Over 4% of homes for sale had price drops, and pending sales are down more than 10% from their 2021 peak.
The average weekly share of homes for sale with a price drop passed 4% for the first time since September, another signal that the hyper-competitive housing market is cooling. Other indicators corroborate the slowdown: the share of homes sold over list price, the share of homes sold within a week and median days on market are all also either cooling off or plateauing.
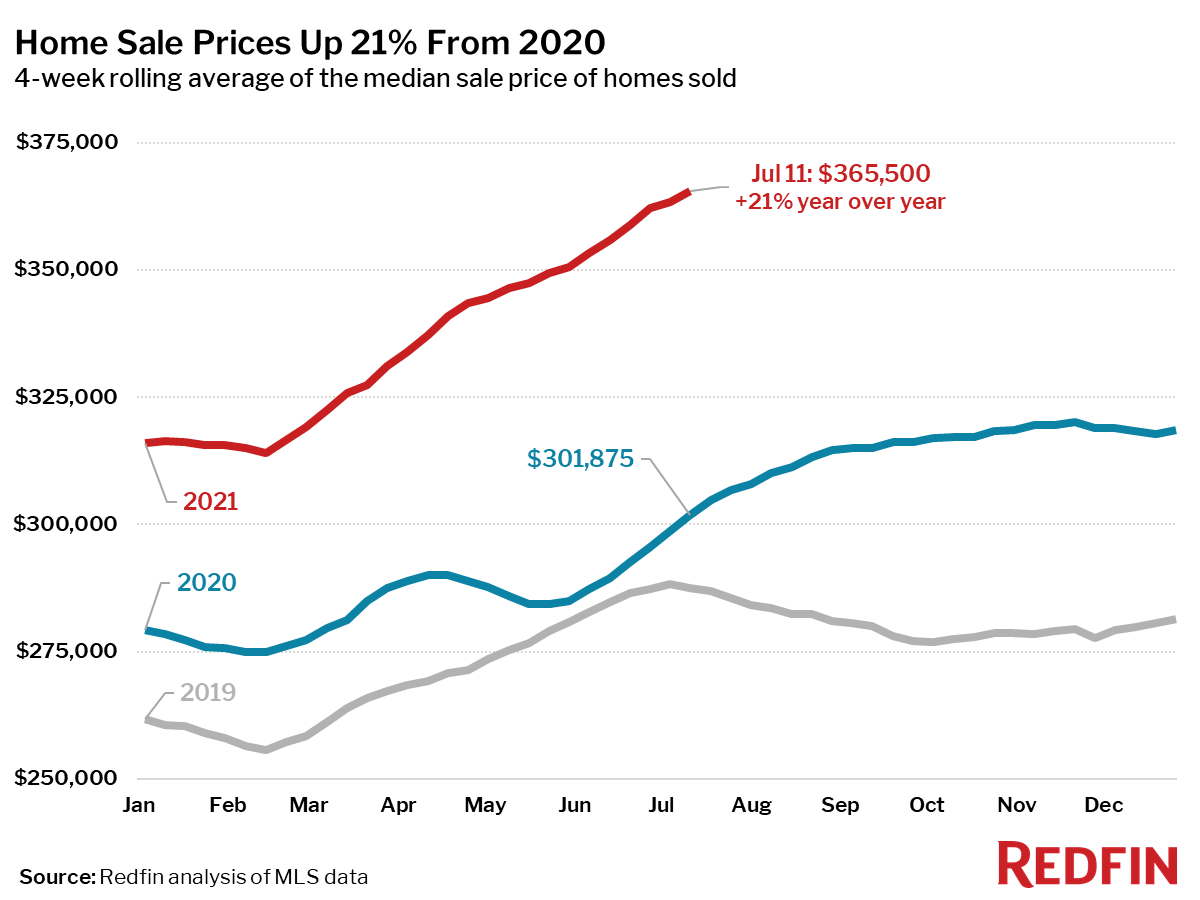
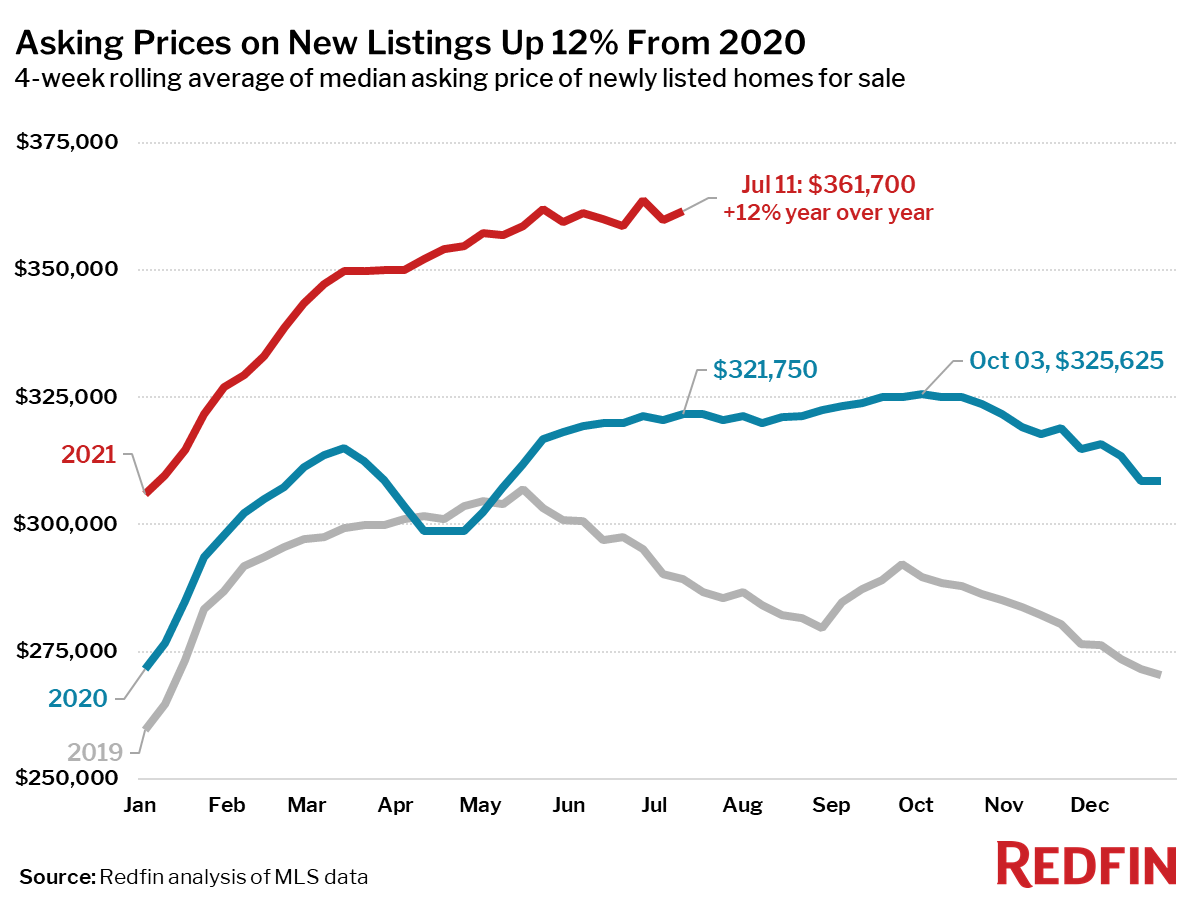
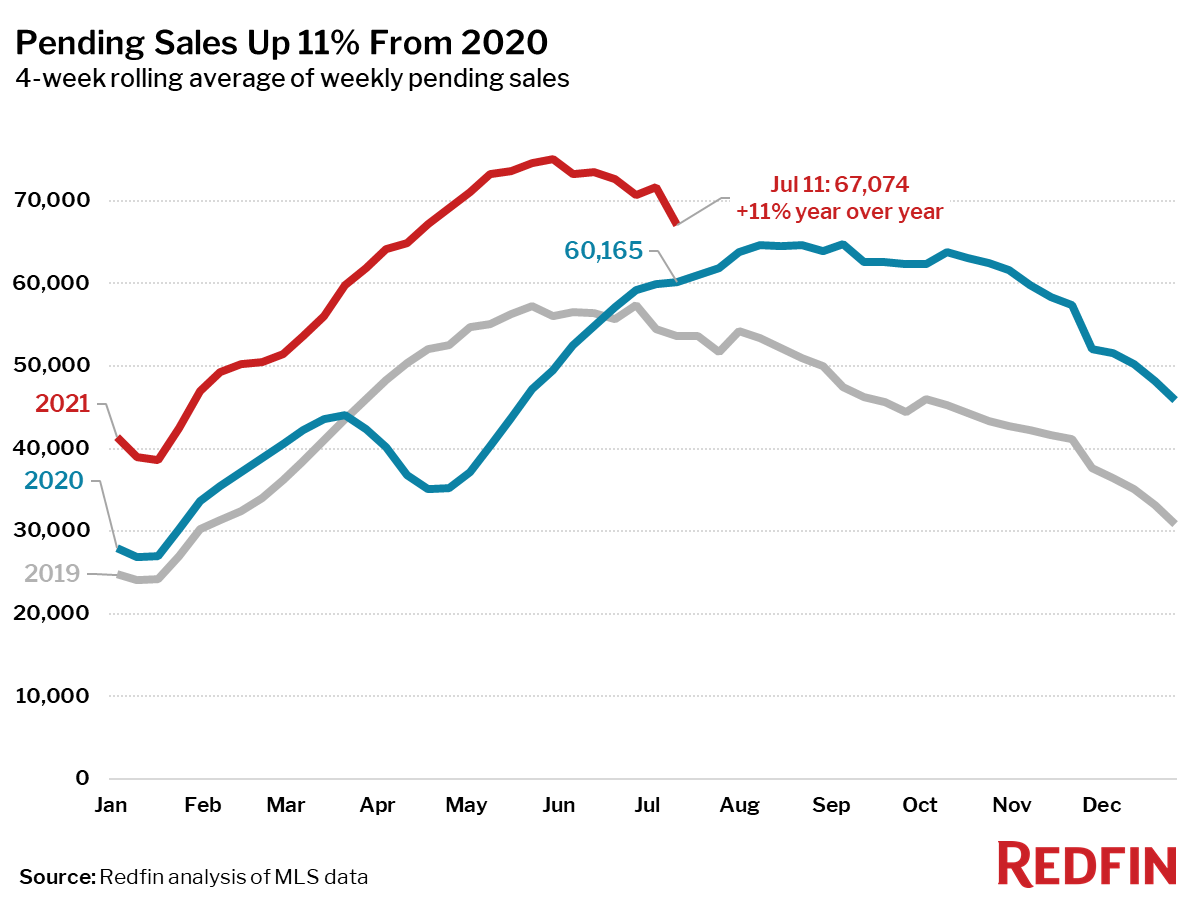
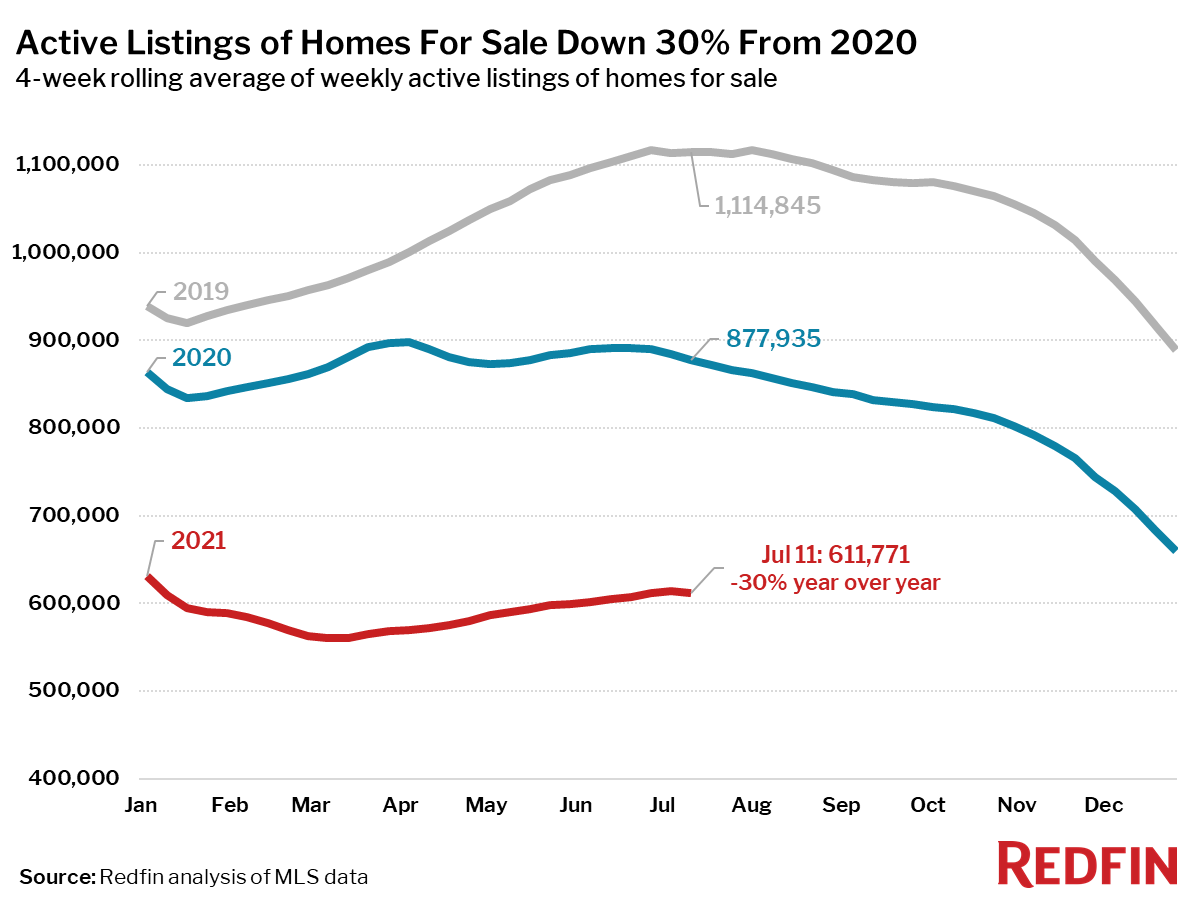
Pending sales were up 11% from a year ago, but down 11% from the 2021 peak, and asking prices have been relatively flat since late May. Even amid this shift, sellers remain in the driver’s seat, as home prices continued to rise more than 20% from a year ago and the number of homes for sale sits 30% below the same time last year.
Looking ahead, some indicators of early-stage homebuyer interest like tour activity, mortgage purchase applications and requests for service from Redfin agents have shown signs of picking back up. It’s too early to call it a trend, but we’ll continue to track whether this continues and leads to sales and competition heating back up.
Unless otherwise noted, the data in this report covers the four-week period ending July 11. Redfin’s housing market data goes back through 2012.
“Asking prices are still high, but the share of listings with price drops is rising steadily and could soon reach pre-pandemic levels,” said Redfin Chief Economist Daryl Fairweather. “That’s an early indication that we are past the peak for this intense seller’s market. Buyers may begin to regain some negotiating power on properties that have been on the market for more than a week.”
Key housing market takeaways for 400+ U.S. metro areas:
Data based on homes listed and/or sold during the period:
- The median home-sale price increased 21% year over year to $365,500, a record high.
- Asking prices of newly listed homes were up 12% from the same time a year ago to a median of $361,700. This is up 0.5% from the four-week period ending July 4, but down 0.6% from the all-time high two weeks ago.
- Pending home sales were up 11% year over year, the smallest increase since the four-week period ending July 5, 2020. Pending sales were down 11% from their 2021 peak during the four-week period ending May 30, compared to a 4% decrease over the same period in 2019.
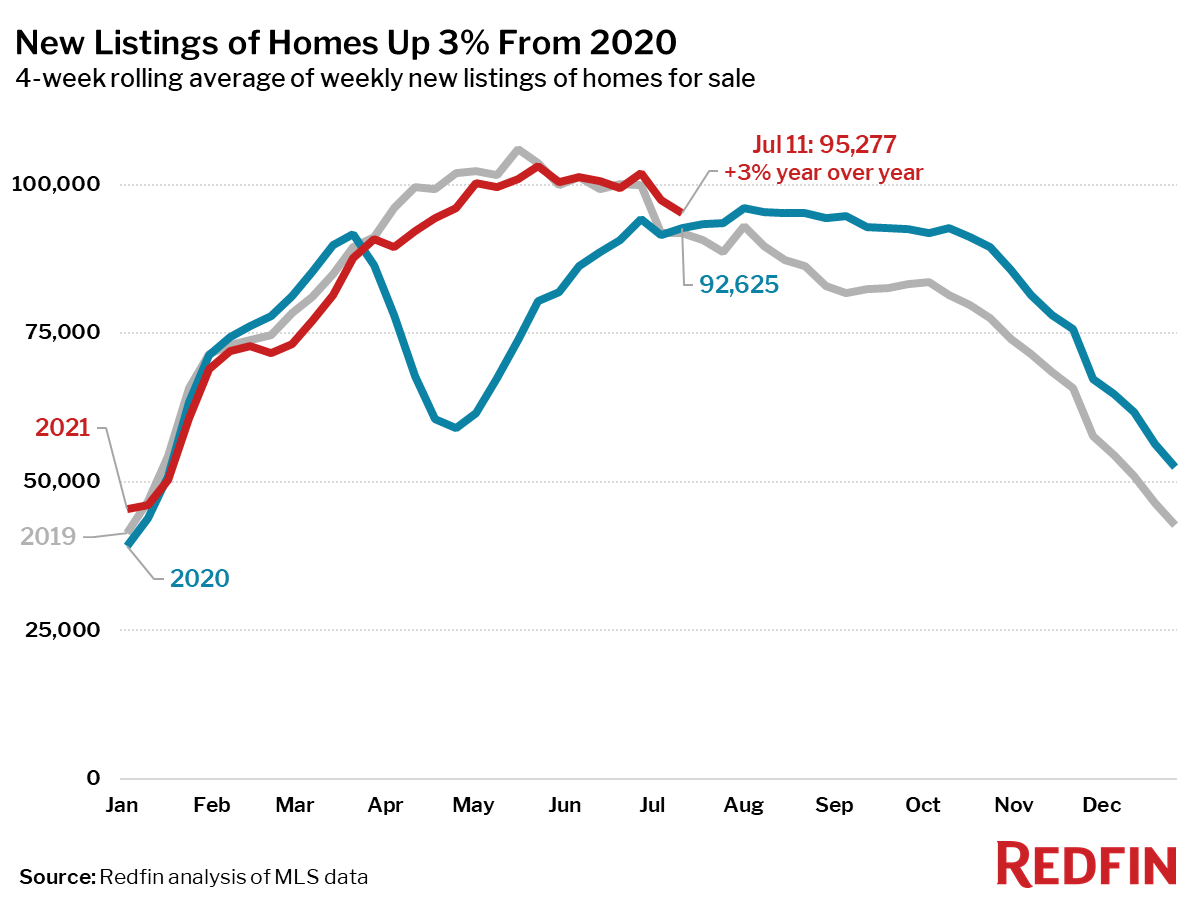
- New listings of homes for sale were up 3% from a year earlier. The number of homes being listed is in a typical seasonal decline, down 8% from the 2021 peak during the four-week period ending May 23, compared to an 11% decline over the same period in 2019.
- Active listings (the number of homes listed for sale at any point during the period) fell 30% from 2020—the smallest decline since the four-week period ending January 31—and have climbed 9% since their 2021 low during the four week period ending March 7.
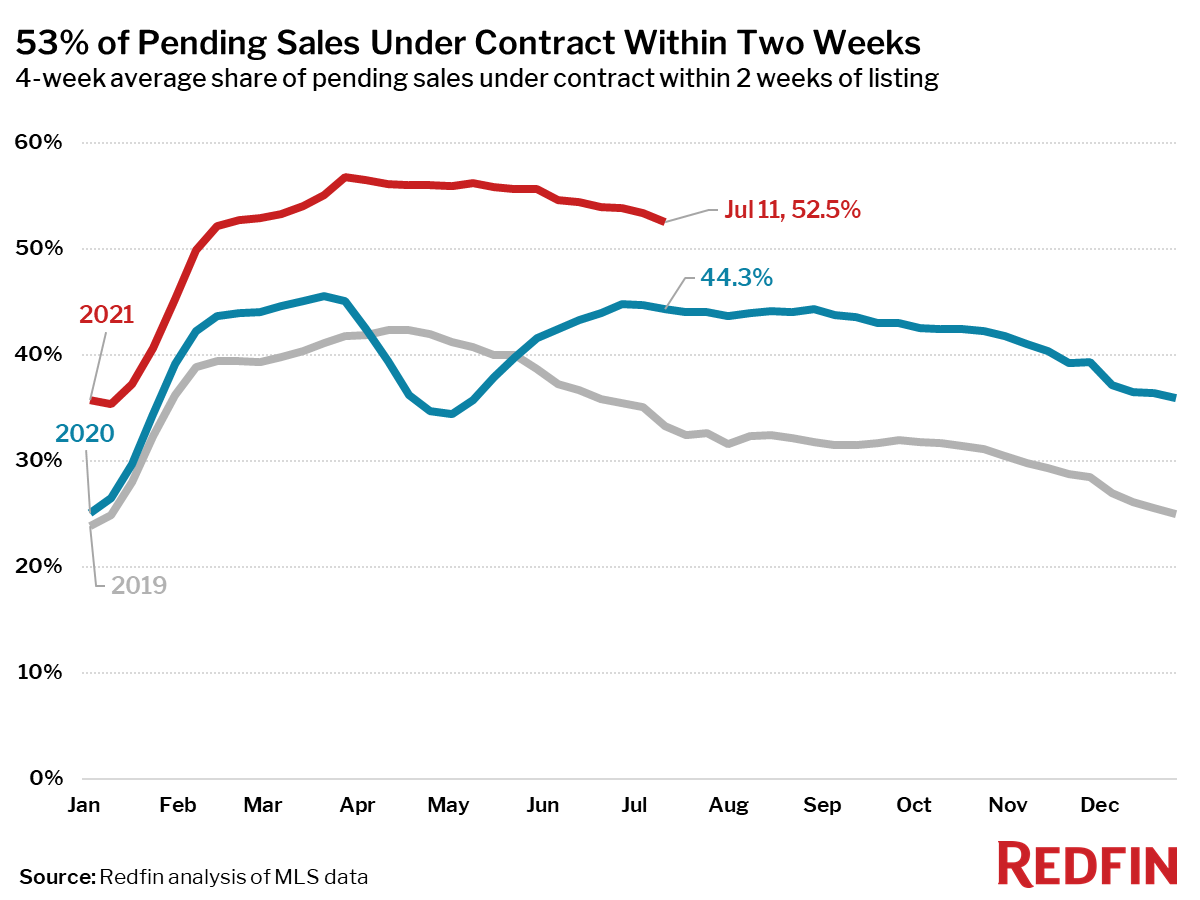
- 53% of homes that went under contract had an accepted offer within the first two weeks on the market, well above the 44% rate during the same period a year ago, but down 4.2 percentage points from the high point of the year, set during the four-week period ending March 28.
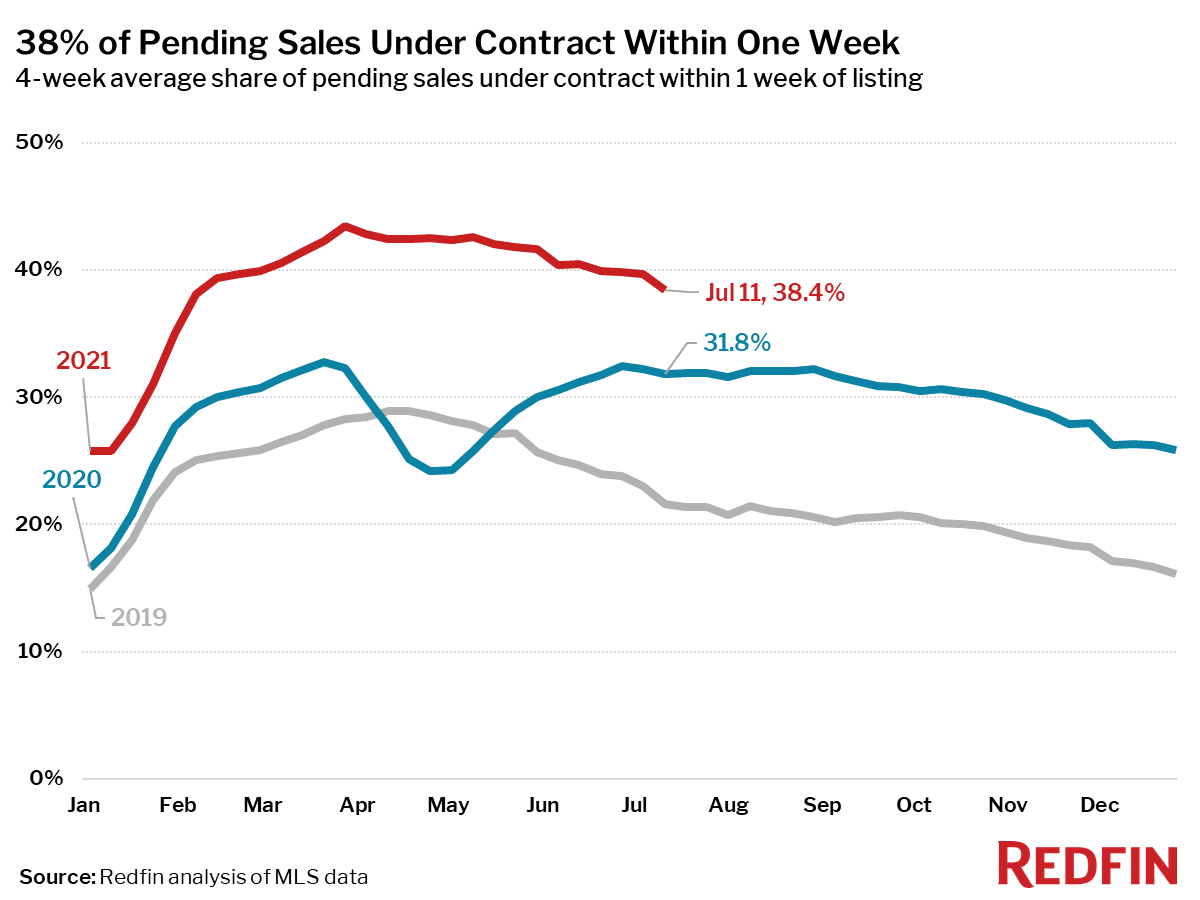
- 38% of homes that went under contract had an accepted offer within one week of hitting the market, up from 32% during the same period a year earlier, but down 5.1 percentage points from the high point of the year, set during the four-week period ending March 28.
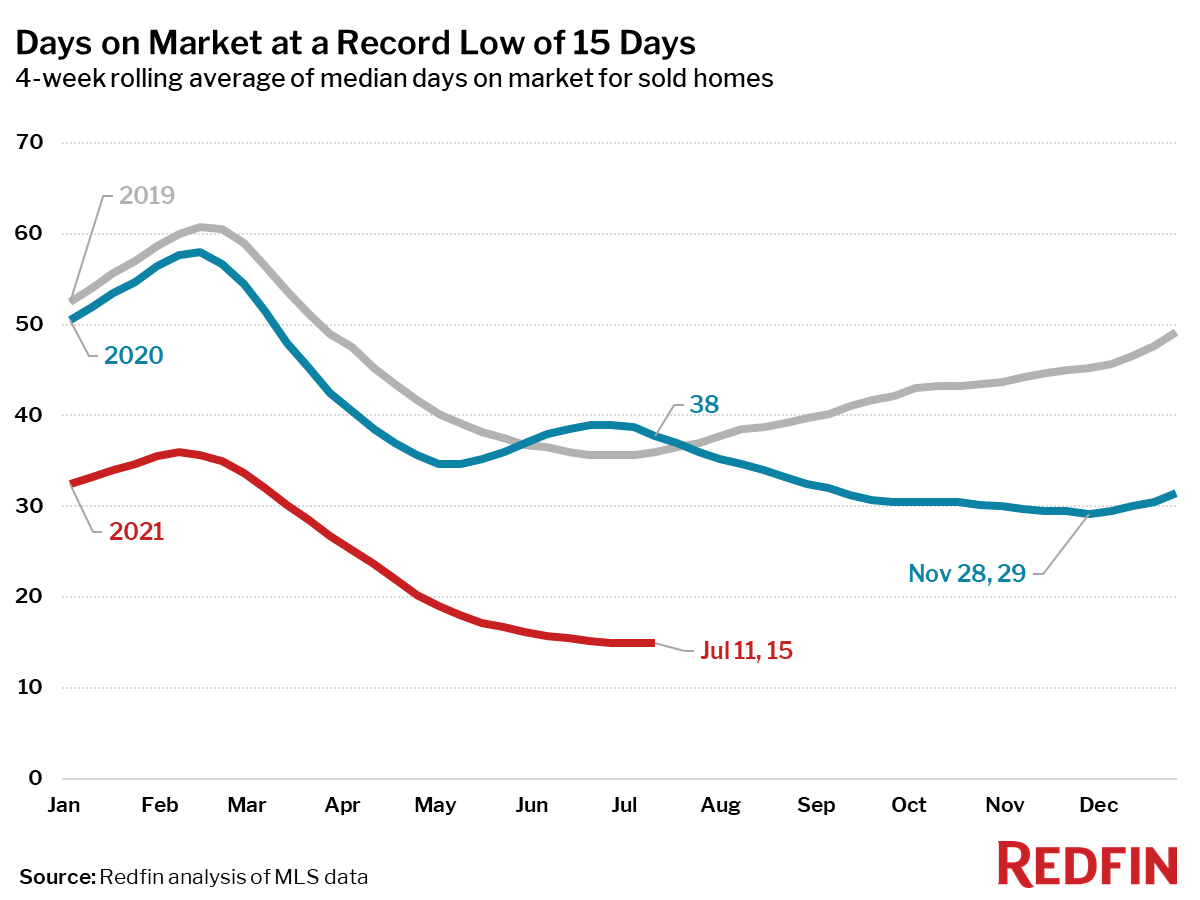
- Homes that sold were on the market for a median of 15 days, an all-time low that has been flat for the last four weeks, and down from 38 days a year earlier.
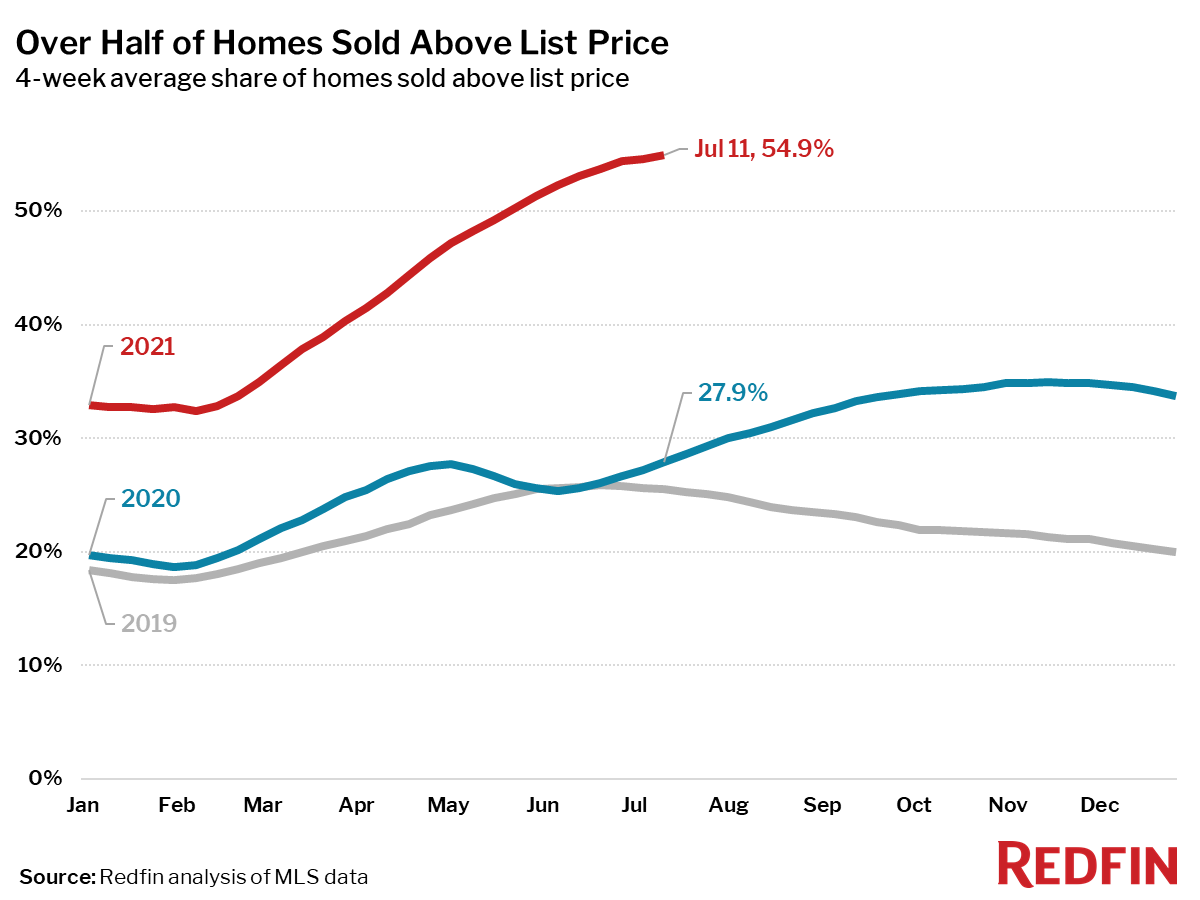
- A record 55% of homes sold above list price, up from 28% a year earlier. This measure is plateauing, having been 54-55% since the four-week period ending June 27.
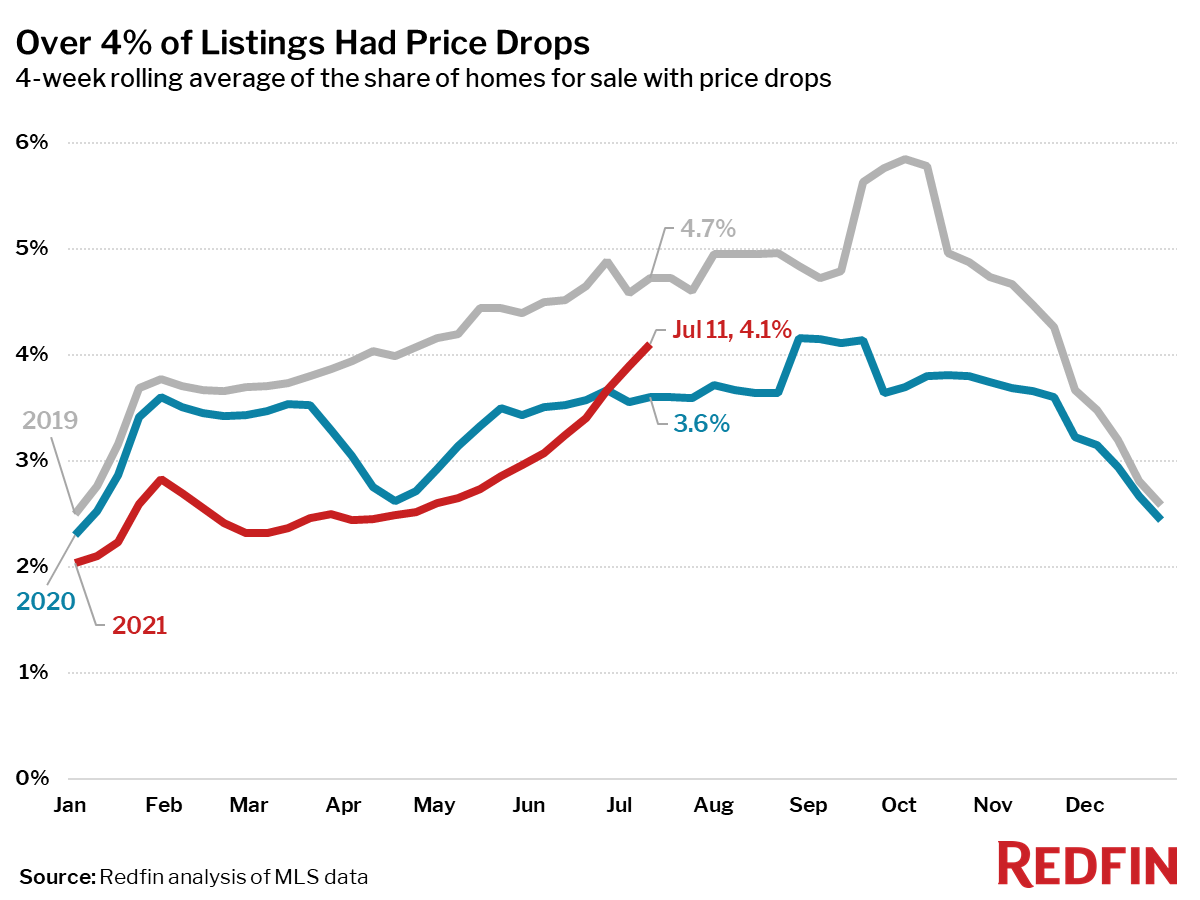
- The share of homes for sale with price drops rose to 4.1%, continuing to surpass 2020 level, and climbing closer to 2019 levels (4.7% at this time in 2019).
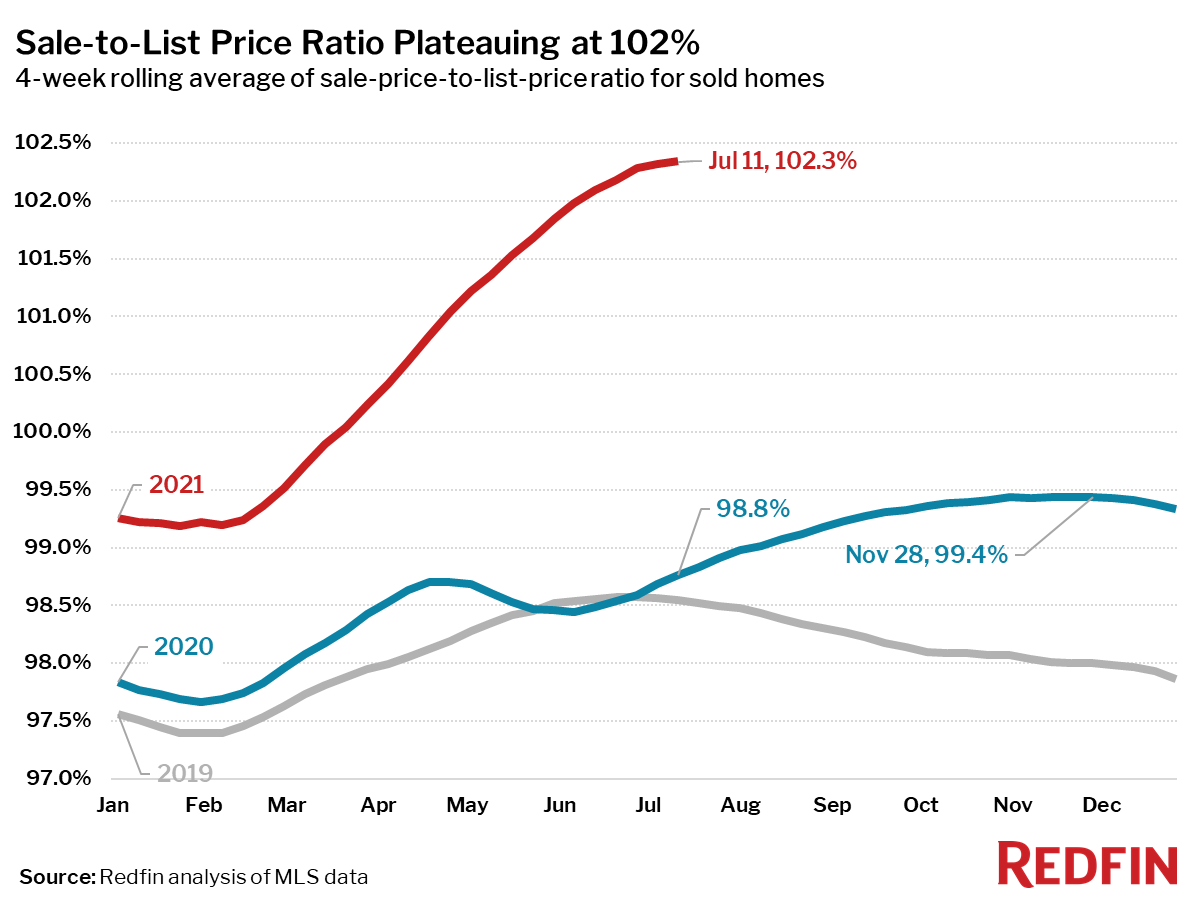
- The average sale-to-list price ratio, which measures how close homes are selling to their asking prices, increased to 102.3%. In other words, the average home sold for 2.3% above its asking price. This measure is an all-time high and 3.5 percentage points higher than a year earlier, but growth has slowed and it may be at or near its peak for the year.
Other other leading indicators of homebuying activity:
- Mortgage purchase applications increased 8% week over week (seasonally adjusted) during the week ending July 9. For the week ending July 15 30-year mortgage rates fell to 2.88%, the lowest level since mid-February.
- From January 1 to July 11, home tours went up 23%, compared to a 50% increase over the same period last year according to home tour technology company ShowingTime.
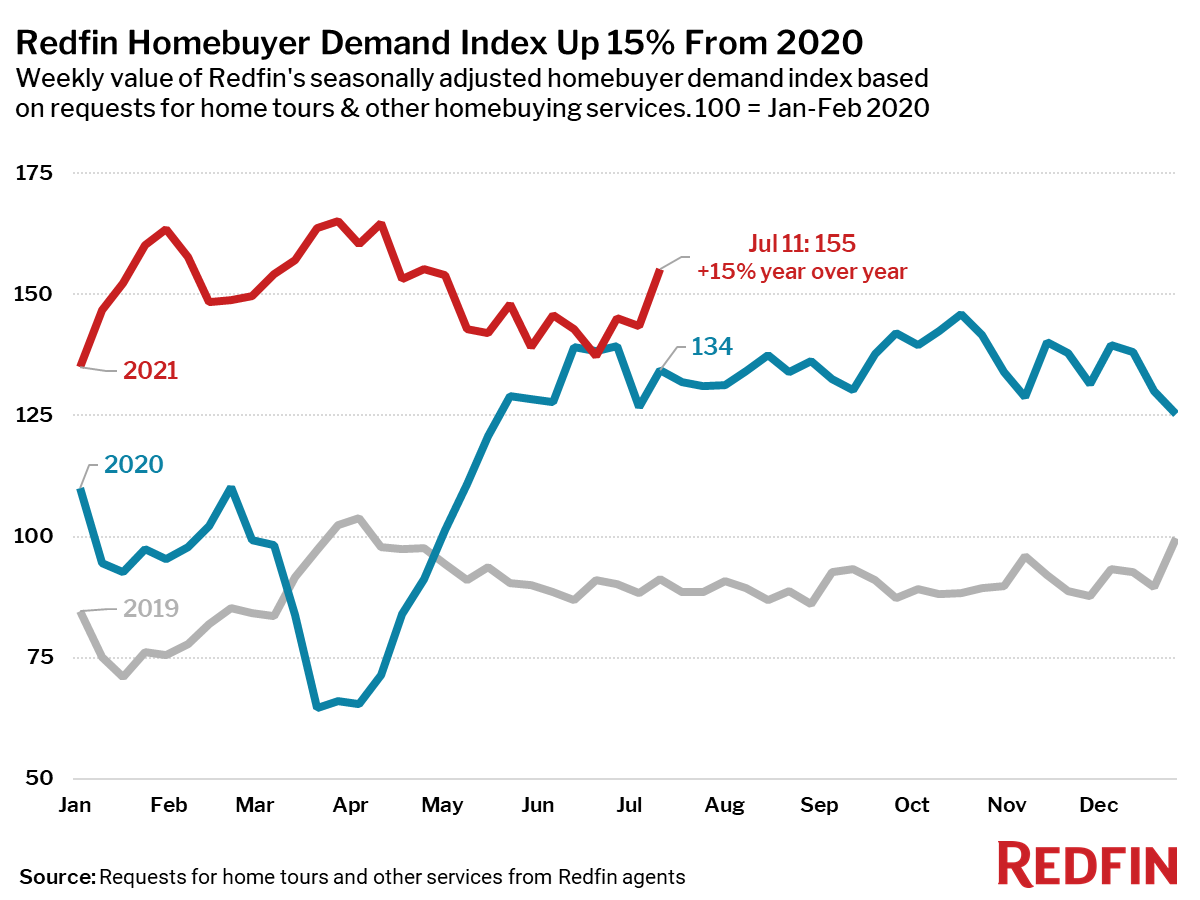
- The seasonally adjusted Redfin Homebuyer Demand Index—a measure of requests for home tours and other services from Redfin agents—rose sharply during the week ending July 11, and is currently up 15% from a year earlier.
Refer to our metrics definition page for explanations of all the metrics used in this report.
 United States
 Canada